
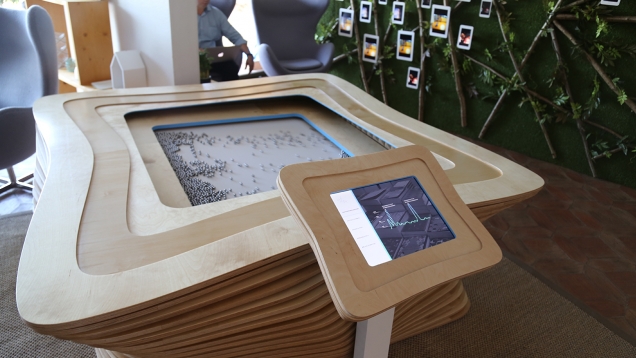
onedotzero created a bespoke installation for twitter at cannes lions festival 2015
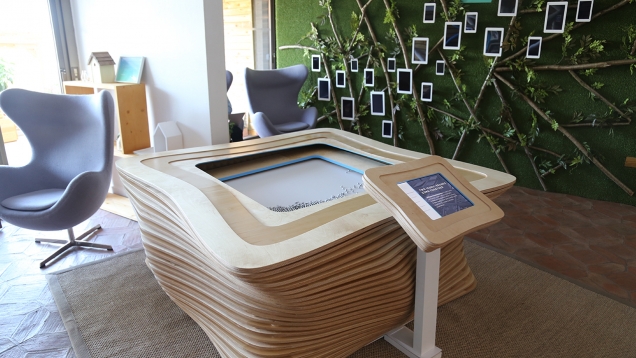
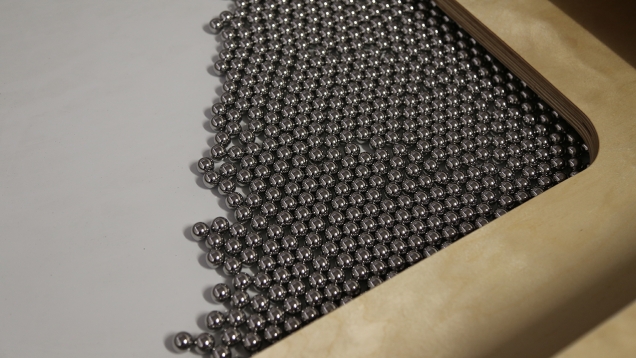
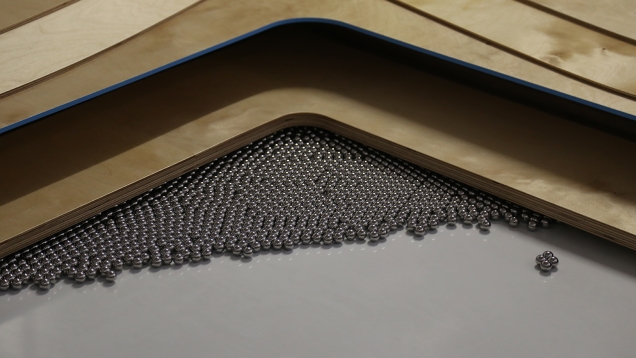
Twitter commissioned onedotzero to create a table that visualizes key Twitter campaigns from the past year. Debuting at the Tweet Suite at Cannes Lions 2015, the work weighs in at a hefty 500kg and features 204 electromagnets, 3000 ball bearings, and 25 layers of CNC cut timber, pulled together by a team of 20 craftsmen over six weeks.
In true onedotzero style, the project was a collaborative effort, combining talent from the Interactive Architecture Lab of the Bartlett, UCL, with the strategic thinking and data science of the team at Twitter. The Twitter Data Visualisation table combines a mix of skills, tools and processes including robotics, engineering, electromagnetism, CNC, carpentry, code and data visualization.
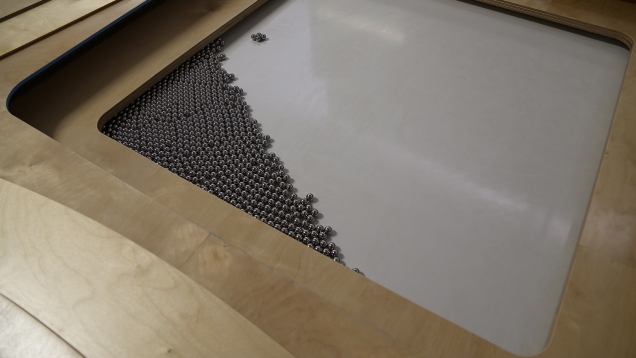
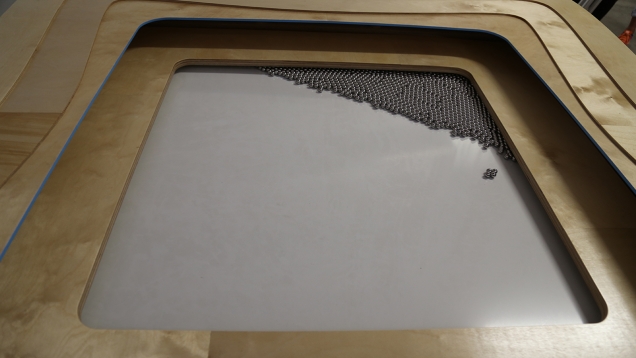
With all the complicated hardware housed within a crafted shell of CNC cut birch ply, users are treated to an organic structure that looks like sun drenched grooves in the sand, and sounds like the ocean, thanks to thousands of ball bearings moving rhythmically across the surface of the table.
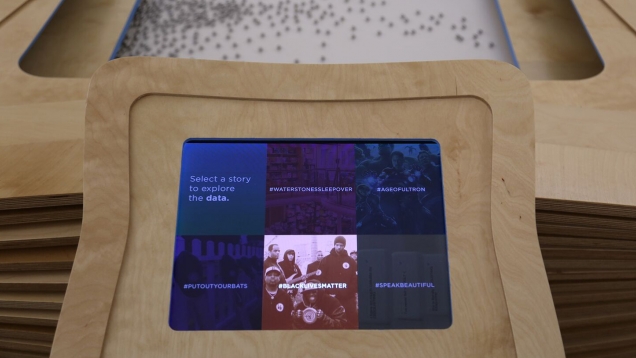
Users interact with the table through a touch screen panel, from which they can choose to explore 5 hashtags. The data sets behind each hashtag are then visualized through a series of choreographies that use motion and magnetism to propel thousands of ball bearings across the surface the table.
The featured campaigns are 5 of the most compelling and successful stories on Twitter over the last year, each telling a powerful story of reach, momentum and impressions. The campaigns are:
#WaterstonesSleepover
#PutOurYourBats
#AgeofUltron
#SpeakBeautiful
#BlackLivesMatter
After its debut at the Tweet Suite at Cannes Lions 2015, the tableheaded to Twitter's San Francisco HQ to take up a permanent residency in their new visitor’s centre.
Photo Credit: Memo Akten